
Operations are important for maintaining daily functions of a bikeshare system (BSS). Here, we analyze and try to measure the efficiency of operating activities of bikeshare through data analytics. We take the valet and corral service as an example of case study on operating activities. If a bikeshare station has valet or corral service, operating staffs will take care of bike returning at the station or keep the station from fully occupied by removing bikes from docks and storing them to a corralled place. Corral service can lift serving capacity of a bikeshare station from a limited to a rather high level during its operational period. In addition, the service can guarantee users to return their bikes at their expected stations, without wasting time (or paying extra fee if the bikeshare charging system is usage-time-based) to frustratingly find an empty dock in neighbor stations. It is especially useful for high-demand stations of bikeshare. In practice, corral service can be provided by bikeshare operators regularly in high-demand seasons or specially on some high-attendance events. We analyze the both conditions in our case study.
Getting the CaBi cheer squad in gear. Corral Service starting an hour before @nationals game time on October 6, 7 & 12th! #corralservice pic.twitter.com/W2rpe1Nwoz
— Capital Bikeshare (@bikeshare) October 2, 2017
Capital Bikeshare (CaBi) provided bike corral service for some high-attendance events. In DC area, the baseball games of Washington Nationals held at Nationals Park have often attracted high attendances. Let us take this event as an example to analyze corral service. CaBi Station 31209 (1st & N St SE) is chosen for this analysis, as it is the nearest station to Nationals Park. The data shows that the top six days in the ranking of the highest daily drop-off counts at Station 31209 are respectively 2012-10-10, 2012-10-11, 2014-10-03, 2014-10-04, 2016-10-07 and 2016-10-13, coincident with the dates when Washington Nationals played their games in the National League Division Series (NLDS) at Nationals Park in 2012, 2014 and 2016. Fig. 1 gives hourly drop-off and pickup counts at Station 31209 around the time when the six events were held at Nationals Park, where the start and end times are respectively marked with two vertical lines. As shown in the figure, both drop-off and pickup hourly counts were very low at Station 31209 during normal time, but they both suddenly increased to reach rather high values around the start and end times of the games. Concerning the corral service for each event, the operational time with respect to work of staffs is  , where
  is the period to handle drop-off demand before the event,
  is the duration of the event, and
  is the period to handle pickup demand after the event. For the six events, is in the range of between 2.92 hours and 6.38 hours. The longer is, the more costly the corral service is. Fig. 1 indicates that corral service significantly increased capacity of Station 31209 for the high-attendance events. As an operating activity, corral service can be very useful and effective for attracting more car users to adopt biking transportation mode when participating these events, which not only augments operating gains of bikeshare, but also relieves the difficulty and problems in transportation due to regional traffic congestion and parking limits.
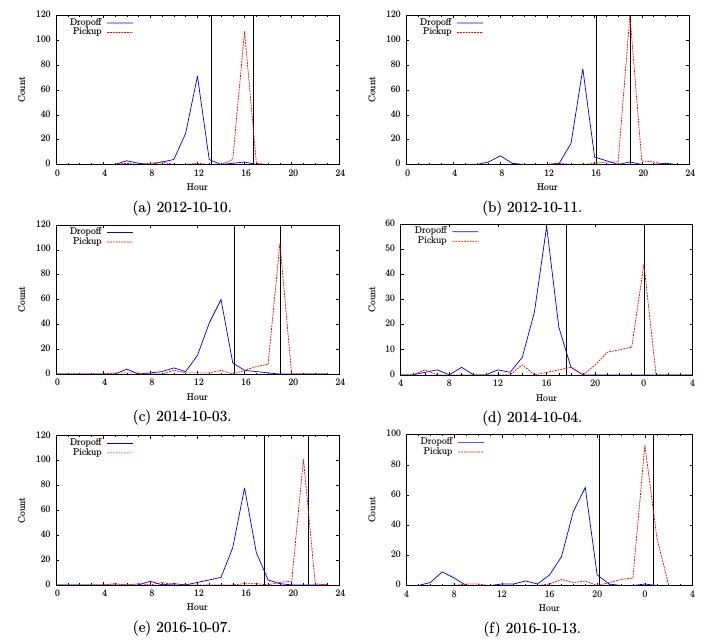
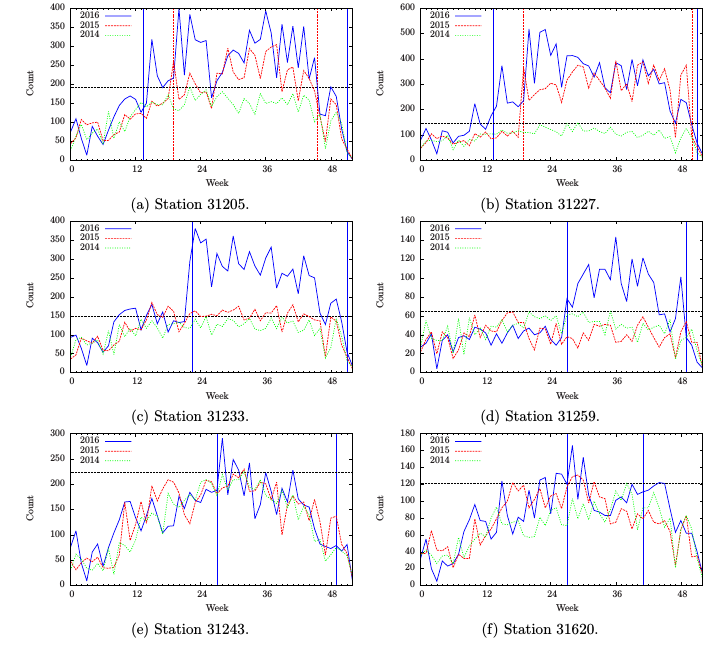
Fig. 2 shows the comparisons of weekly drop-off counts during [8AM, 12PM] of Weekdays among 2014 (green), 2015 (red), and 2016 (blue) respectively at each of the six stations where seasonally regular bike corral service was provided by CaBi in 2015 and 2016. In the figure, the start and end dates of corral service are all marked using vertical lines. Notice that neither station in 2014 nor any of the last four CaBi stations in 2015 was provided corral service by CaBi. These results of no corral service provide us baselines to compare bikeshare capacity for studying effects of corral service. For each station without corral service, let  be its maximum weekly drop-off count and
  its maximum weekly capacity, then is an approximation to the lower bound of . As shown in Fig. 2, during the periods without corral service, all the weekly drop-off counts are below
  , where is the peak weekly drop-off count in 2014 (see the horizon lines in Fig. 2) and
  is a small value representing the noises in data. It turned out that the peak demand in 2014 was sufficiently high to yield the results of approaching . More importantly, Fig. 2 reveals that at each of the six stations, the value of with corral service (in 2015 or 2016) is higher than that without the service, reflecting that corral service has the capability of raising capacity of bikeshare stations. Concerning the six CaBi stations in Fig. 2, it is worth noting that corral service led to significant increases in weekly drop-off counts at four of the stations, but induced only a little change at the other two stations. In Figs. 2a through 2d, the increase in weekly counts is notable for most of the weeks with corral service. While in Figs. 2e and 2f, weekly drop-off counts are found raised only for a few of the weeks with corral service, and the extent of increase in weekly drop-off counts is rather small in comparison with those shown in Figs. 2a through 2d. The results provide us a straightforward MoE on corral service at different stations. To augment the overall QoS and operational efficiency, operators of BSS would need optimize their operating activities. As an example, Fig. 2 shows that data analysis is able to provide bikeshare operators evidence-based supports to help them reallocate their resources such as redistribute corral service among different stations for a better operational efficiency.
Although the system data does not provide the details of redistribution efforts at these stations, we can gain the insights by comparing the redistribution efforts between different years. Here, as an example, we compare the redistribution efforts during [8AM, 12PM] from the start to the end dates of corral service in 2016 with those during the same time-of-day and date-of-year period in 2014. The comparison is performed with the following method. At each station  , we collect all the trips that have arrived the station during the considered time period in each year as
  . For each
  , the next trip
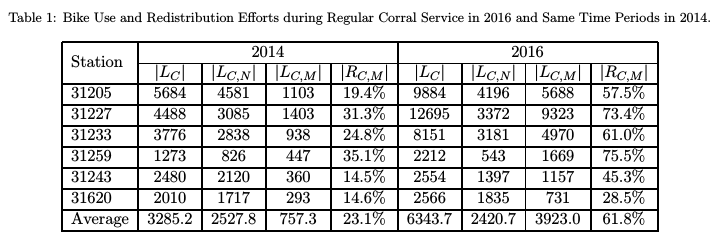
  using the same bike is extracted. If the origin station of is the same as , the bike is considered as in normal use, otherwise as in maintenance. In this context, the maintenance activity would most likely be the redistribution effort moving the bike from to the origin station of . Table 1 summarizes the results in the two years of 2014 and 2016, where
  ,
,  , and
, and  are respectively the numbers of total trips arriving the station, the trips in normal use departing at the station, and the maintenance trips at the station, and
  . It is clear that coral service has enabled the bike stations to serve users with more trips. As shown in Table 1, although the number of departing trips, , remained similar in the two years, the number of arriving trips, , increased significantly from 2014 to 2016 due to corral service (which was used in 2016 but not in 2014). Table 1 also shows that the number of bikes in maintenance (mainly redistribution) trips, , remarkably increased in 2016, compared to 2014. It is consistent with the fact that the number of arriving trips, , is mostly much larger than that of departing trips, , at the stations. Essentially, corral service at a station could function as a temporary bike depot during the service period, but the corralled bikes should be cleared/redistributed from the station before the end of service.
Although the redistribution operation might be costly, it could increase the availability and usage of bikes. The corralled bikes could be relocated to the stations in supply shortage, therefore total bike ridership could be increased, leading to an operational gain that would offset redistribution cost. Some of the increased ridership in bikeshare could contribute to reducing VMT, which would offset the impact to environment from using rebalancing trucks in the redistribution operation. In addition, with corral service at the stations, high capacity trucks could be utilized to redistribute a large number of bikes at once, which would reduce the average redistribution cost and the impact to environment per bike. Another cost-effective operational option could be extending the service to the PM peak period. In this case, corralled bikes would be picked up by users, rather than call for any redistributions by system operators. Notice that, in one hand, the extension of corral service could support normal bike trips for more revenue and reduce redistribution efforts for less costs; in another hand, the extension of service time would need several extra work hours of staffs and also reduce bicycle availability as some bikes would stay in corrals. An optimization should be considered by system operators in order to reach the best solution in corral service operations.
![]() By Xiao-Feng Xie, Ph.D. —— The WIOMAX Blog
By Xiao-Feng Xie, Ph.D. —— The WIOMAX Blog
This blog is adapted from the following research paper:
- “Examining travel patterns and characteristics in a bikesharing network and implications for data-driven decision supports: Case study in the Washington DC area,” Journal of Transport Geography, vol. 71, 2018.
![[PDF]](http://www.wiomax.com/wp-content/plugins/papercite/img/pdf.png)
![[DOI]](http://www.wiomax.com/wp-content/plugins/papercite/img/doi.png)
![[Bibtex]](http://www.wiomax.com/wp-content/plugins/papercite/img/bib.png)
@Article{Xie2018Bike,
Title = {Examining travel patterns and characteristics in a bikesharing network and implications for data-driven decision supports: Case study in the {Washington DC} area},
Author = {Xiao-Feng Xie and Zun-Jing Wang},
Journal = {Journal of Transport Geography},
Volume = {71},
Pages = {84--102},
PDF={http://www.wiomax.com/team/xie/paper/JTRG18Pre.pdf},
Doi = {10.1016/j.jtrangeo.2018.07.010},
Year = {2018}
}
WIOMAX is a research and consulting team to explore real-time, smart and scalable solutions especially for applications to achieve Smart Mobility and Smart Cities by integrating cutting-edge DOAI [Data Analytics + Optimization + Artificial Intelligence (AI) + Internet of Things (IoT)] technologies, from basic research to industry transition and product development and support.