Here are some case studies that WIOMAX researchers and engineers have done on data analytics and urban computing. We hope these knowledge would significantly contribute to deeper understandings and potential improvements that lead to smart transportation.
Bike Sharing Analysis & Data-Driven Decision Supports: Washington DC |
|---|
Bikesharing has gradually become an adopted form of mobility in urban area recent years as one sustainable transportation mode to bring us many social, environmental, economic, and health-related benefits and rewards. There is increased research toward better understanding of bikesharing systems (BSS) in urban environments. However, our comprehension remains incomplete on the patterns and characteristics of BSS.
- “Examining travel patterns and characteristics in a bikesharing network and implications for data-driven decision supports: Case study in the Washington DC area,” Journal of Transport Geography, vol. 71, 2018.
![[PDF]](http://www.wiomax.com/wp-content/plugins/papercite/img/pdf.png)
![[DOI]](http://www.wiomax.com/wp-content/plugins/papercite/img/doi.png)
![[Bibtex]](http://www.wiomax.com/wp-content/plugins/papercite/img/bib.png)
@Article{Xie2018Bike,
Title = {Examining travel patterns and characteristics in a bikesharing network and implications for data-driven decision supports: Case study in the {Washington DC} area},
Author = {Xiao-Feng Xie and Zun-Jing Wang},
Journal = {Journal of Transport Geography},
Volume = {71},
Pages = {84--102},
PDF={http://www.wiomax.com/team/xie/paper/JTRG18Pre.pdf},
Doi = {10.1016/j.jtrangeo.2018.07.010},
Year = {2018}
}
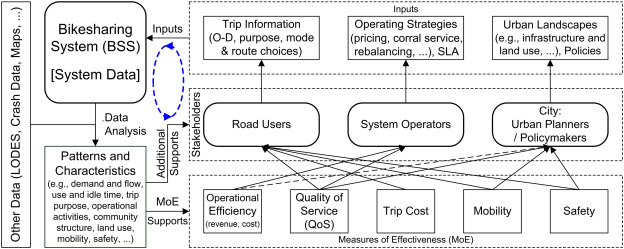 In this work, aiming to help improving sustainability in multimodal transportation through BSS, we perform a systematic data analysis to examine underlying patterns and characteristics of the system dynamics in a bikeshare network and to acquire implications of the patterns and characteristics for decision making. As a case study, we use trip history data from the Capital Bikeshare system in the Washington DC area and some additional data sources. The study covers seven important aspects of bikeshare transportation systems, which are respectively trip demand and flow, operating activities, use and idle times, trip purpose, origin-destination flows, mobility, and safety. For these aspects, by using appropriate statistical methods and geographic techniques, we investigate travel patterns and characteristics of BSS from data to evaluate the qualitative and quantitative impacts of the inputs from key stakeholders on main measures of effectiveness such as trip costs, mobility, safety, quality of service, and operational efficiency, where key stakeholders include road users, system operators, and city. We also disclose some new patterns and characteristics of BSS to advance the knowledge on travel behaviors. Finally, we briefly summarize our findings and discuss the implications of the patterns and characteristics for data-driven decision supports from the relations between BSS and key stakeholders for promoting bikeshare utilization and transforming urban transportation to be more sustainable.
Road Safety Analysis: Montgomery County, MD |
|---|
In this work, we analyze road safety with an integration of multiple data sources on multiple scales. As a case study, we consider three datasets, including the nationwide Fatality Analysis Reporting System (FARS), the statewide traffic crashes in Maryland (MDCrash), and the countywide traffic violations in Montgomery County, MD (MoCoVio).
- “Multiscale crash analysis: A case study of integrating FARS, Maryland’s crash data, and Montgomery County’s traffic violation data,” in Transportation Research Board (TRB) Annual Meeting, Washington, DC, 2018.
![[DOI]](http://www.wiomax.com/wp-content/plugins/papercite/img/lnk.png)
@InProceedings{xie2018multiscale,
title={Multiscale crash analysis: A case study of integrating {FARS}, {Maryland}'s crash data, and {Montgomery County}'s traffic violation data},
author={Xie, Xiao-Feng and Wang, Zun-Jing},
Booktitle = {Transportation Research Board (TRB) Annual Meeting},
number={18-2283},
Address = {Washington, DC},
LNK={https://trid.trb.org/View/1495254},
PDF={http://www.wiomax.com/team/xie/paper/TRB18.pdf},
year={2018}
}
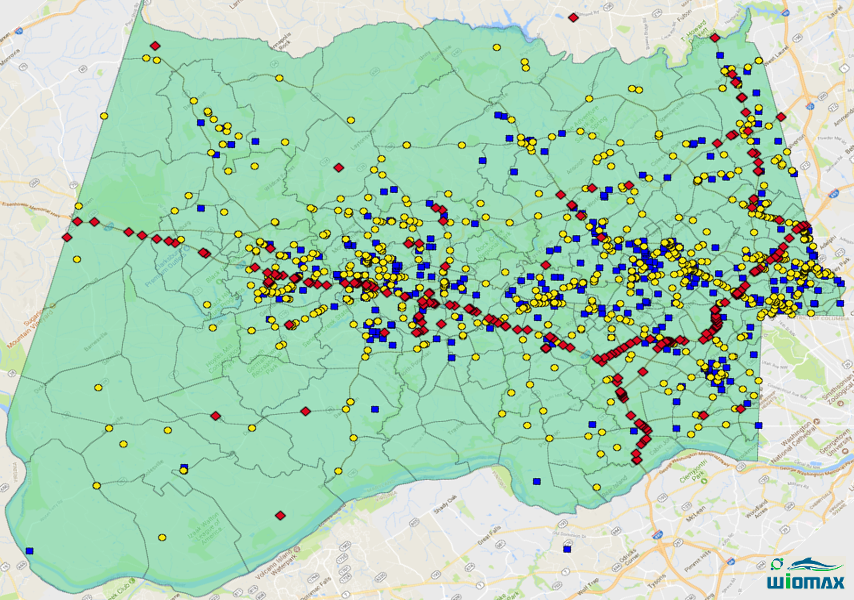 We explore practical values of the multiple data integration on road crash analysis. The crash risk patterns extracted from data fusion is shown to be rather valuable. By identifying determinant risk factors in the patterns, we can better understand the effects of other risk factors. In addition, conditional risk matrix can be computed from data integration to measure the probability of the injury levels and to evaluate the impact of each individual risk factor on injuries. Finally, we conduct a multi-source data integration to discover the safety factors for pedestrians, where we obtain temporal patterns from FARS but acquire spatial patterns from the traffic crash and violation data. The results indicate that, in comparison with only using FARS, integrating multiple data has the power of showing more insights of the patterns on risk factors for traffic crashes, which allows us to not only better optimize limited resources but also realize more effective countermeasures for enhancing road safety.
Taxi Data Analysis for Urban Mobility & City Dynamics: Washington DC |
|---|
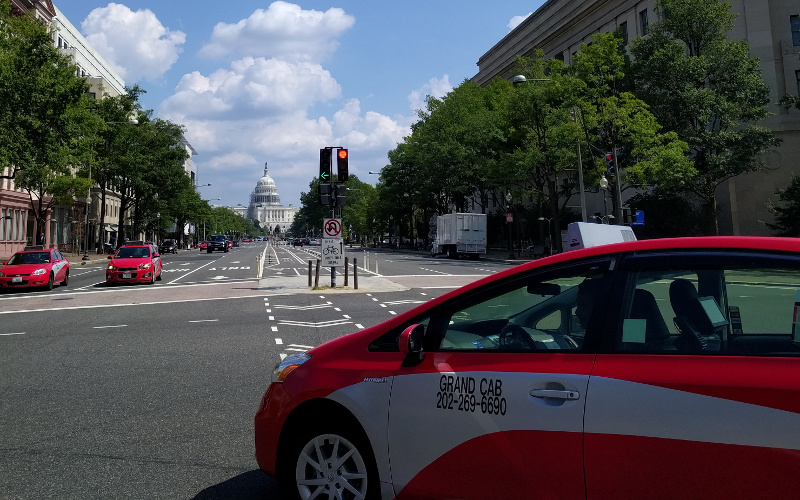 We perform a systematic analysis on the large-scale taxi trip data to uncover urban mobility and city dynamics in multimodal urban transportation environments. As a case study, we use the taxi origin-destination trip data and some additional data sources in Washington DC area. We first study basic characteristics of taxi trips, then focus on five important aspects. Three of them concern urban mobility, which are respectively mobility and cost including effect of traffic congestion, trip safety, and multimodal connectivity; the other two pertain to city dynamics, which are respectively transportation resilience and the relation between trip patterns and land use. For these aspects, we use appropriate statistical methods and geographic techniques to mine patterns and characteristics from taxi trip data for better understanding qualitative and quantitative impacts of the inputs from key stakeholders on available measures of effectiveness on urban mobility and city dynamics, where key stakeholders include road users, system operators, and city. Finally, we briefly summarize our findings and discuss some critical roles and implications of the uncovered patterns and characteristics from the relation between taxi system and key stakeholders. The results can support road users by providing evidence-based information of trip cost, mobility, safety, multimodal connectivity and transportation resilience, can assist taxi drivers and operators to deliver transportation services in a higher quality of mobility, safety and operational efficiency, and can also help city planners and policy makers to transform multimodal transportation and to manage urban resources in a more effective and better way.
- “Uncovering Urban Mobility and City Dynamics from Large-Scale Taxi Origin-Destination (O-D) Trips: Case Study in Washington DC Area,” WIOMAX, WIO-TR-18-003, 2018.
@TechReport{xie2018uncovering,
title = {Uncovering Urban Mobility and City Dynamics from Large-Scale Taxi Origin-Destination ({O-D}) Trips: Case Study in {Washington DC} Area},
author = {Xiao-Feng Xie and Wang, Zunjing Jenipher},
year = {2018},
number = {WIO-TR-18-003},
Institution={WIOMAX},
PDF = {http://www.wiomax.com/doc/report/WIO-TR-18-003.pdf},
DOI = {10.13140/RG.2.2.32170.72644},
urldate = {2018-07-25},
upddate = {2018-07-25}
}
Participatory Sensing for Urban Mobility Analysis: City of Pittsburgh, PA |
|---|
This work combines social media and sensor data to measure the road safety in the Pittsburgh Metropolitan area.
- “An empirical study of combining participatory and physical sensing to better understand and improve urban mobility networks,” in Transportation Research Board (TRB) Annual Meeting, Washington, DC, 2015.
![[PPT]](http://www.wiomax.com/wp-content/plugins/papercite/img/ppt.png)
@InProceedings{Xie2015,
Title = {An empirical study of combining participatory and physical sensing to better understand and improve urban mobility networks},
Author = {Xiao-Feng Xie and Zun-Jing Wang},
Booktitle = {{Transportation Research Board (TRB) Annual Meeting}},
number={3238},
PDF={http://www.wiomax.com/team/xie/paper/TRB15LBSN.pdf},
PPT={http://www.wiomax.com/team/xie/demo/TRB15_demo_BigData_UrbanInformatics.pdf},
LNK={https://trid.trb.org/View/1337999},
Year = {2015},
Address = {Washington, DC}
}
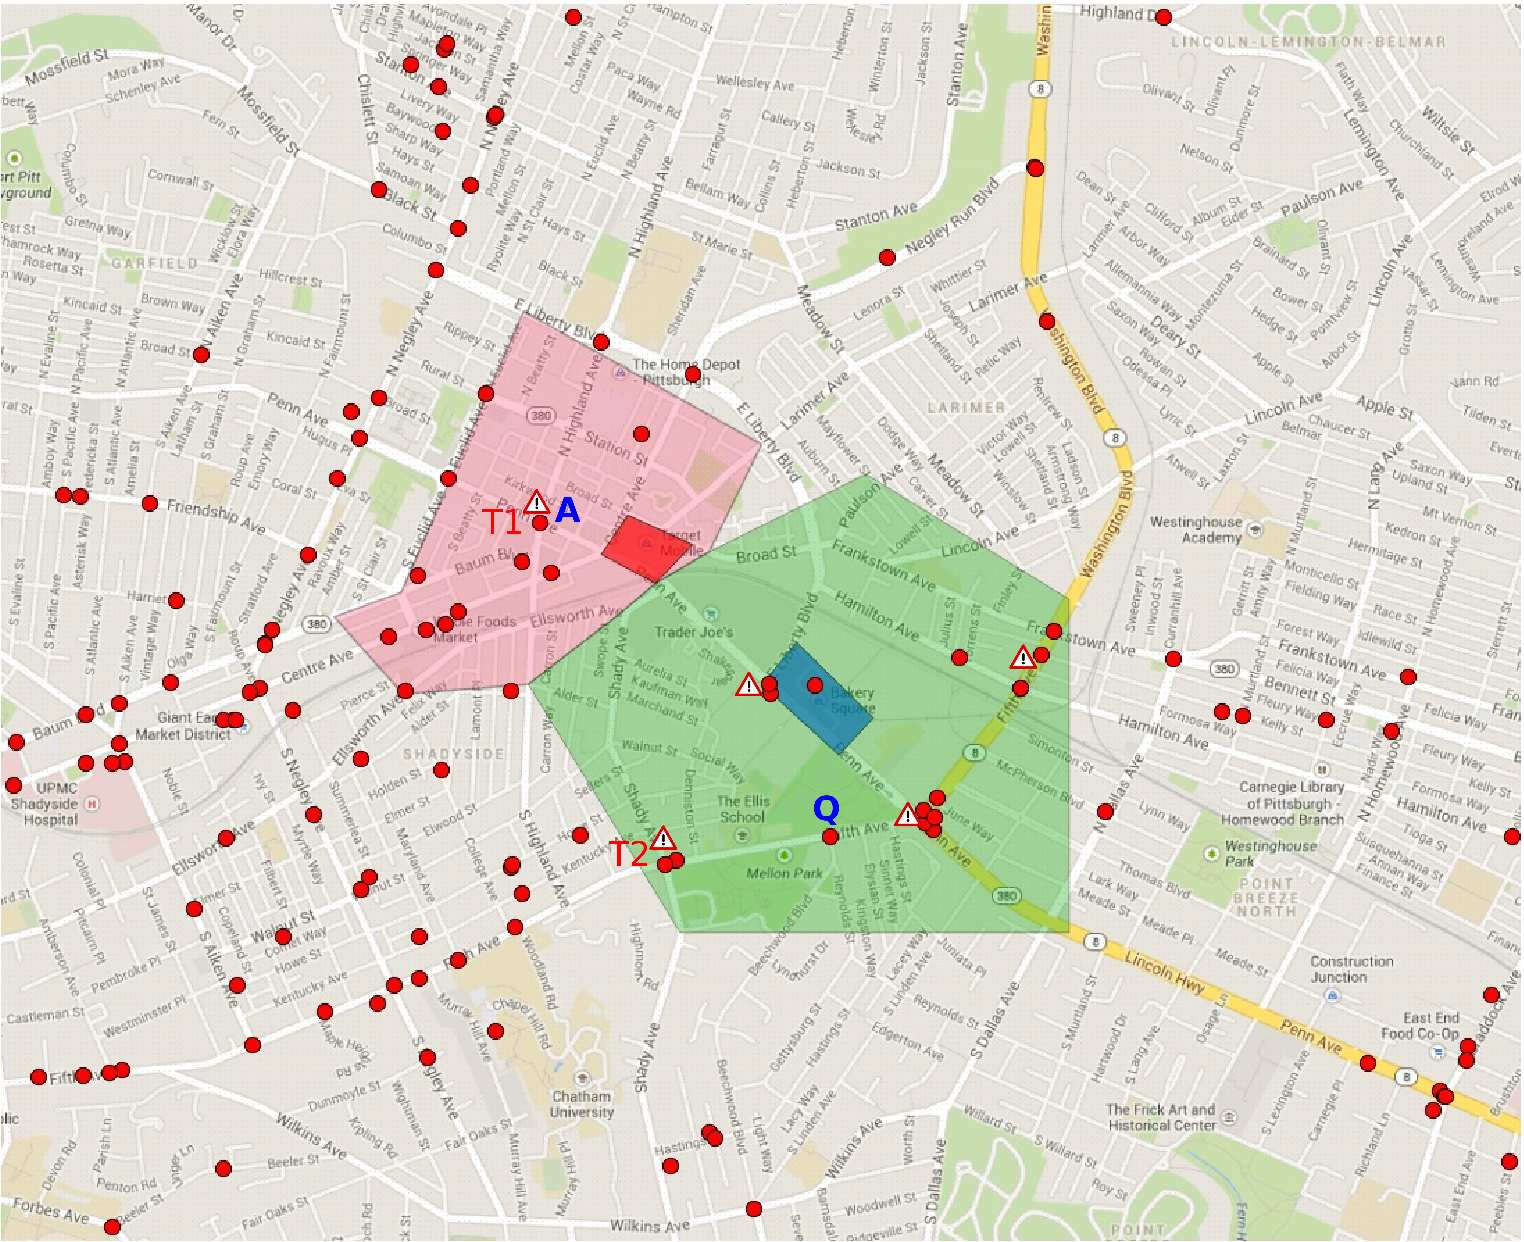 The collected data contains 3,399,376 checkins of 74,658 users at 2,198,572 venues. The temporal patterns of the checkins for “accident” (as the sub-topic) discloses that people should pay more attention to avoid accidents during the morning rush hours, especially for the peaks.
We found that the spatial checkin distribution is surprisingly broad for the “accident” sub-topic. This implies the importance of further improving the urban road safety (which might be addressed in the emerging autonomous and connected vehicle technology).